The Centers for Medicare and Medicaid Services, CMS, recently released the latest 2017 Open Payments data, providing now a total of over four years of pharma payment data for analysis. The total database now contains details of over 74 million payments to nearly one million physicians and over four thousand hospitals.
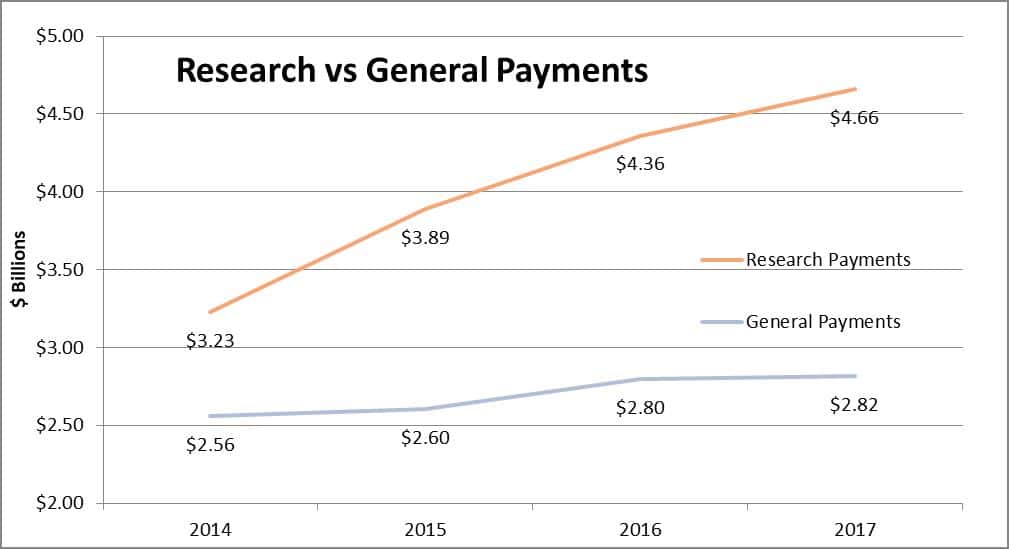
A lot can be learned about overall trends and individuals and institutions. Analyzing the results, we have found that research payments have shown a healthy average annual increase of 14.8%, with 2017 payments totaling $4.66 Billion. Not so the “General” payments, covering the gamut of the typical payments such as consulting, speakership, food & beverage, royalties etc. which has been rising at an average annual rate of 3.4%, only about 1% over inflation, to a total for 2017 of $2.82 Billion.
Under the Hood
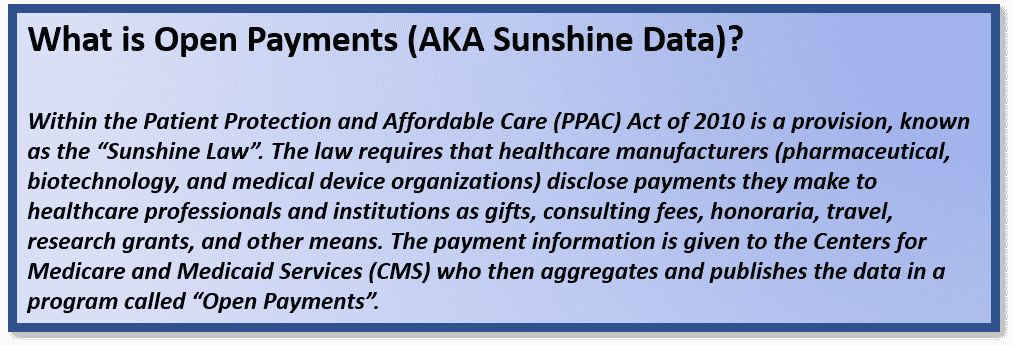
Digging deeper, we see some trends within the General payments. Staple general payments to physicians, like Food & Beverage ($237 Million in 2017) and Travel ($188 Million in 2017), are basically flat at under 2% per annum – just under the rate of inflation, while Gifts are the same in 2017 as they were in 2014, at $29 Million.
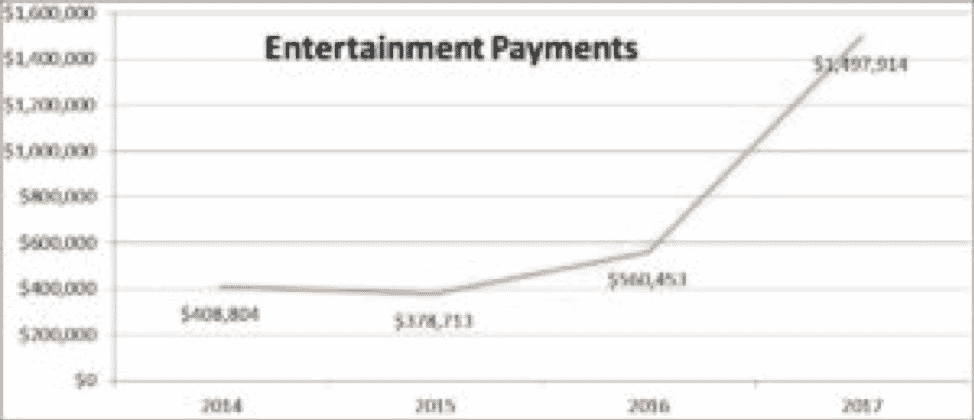
However, Entertainment payments although the smallest of the payment categories, trebled in size last year to $1.5 Million.
Formula One Drivers
In terms of physician-company collaborative relationships, we also see a shift from Speaker roles (down 2.6% per annum to $612 Million in 2017), to Consulting roles (up 5.4% to $429 Million).

Where the Rubber hits the Road
The utility of Open Payments data goes well beyond an overview of who is doing what. Targeted analysis may be performed of this rich dataset which can help in critical decision making:
- By drug: Identify the most highly paid physicians in certain activities for a target list of drugs, categorized into speaking, consulting, and research engagements.
- By competitors: Analyze the competition – see how your competitors compere in their budgets for engagement strategy and where and on whom they spend their money.
- By KOLs: Analyze the work of your own and other KOLs, find who is funding them, and how you stack up against them
- By partners: Find new partners for your business plan, and analyze current partners, by identifying companies developing and marketing complementary products who are spending in your target areas.
- Trend analysis: Find trends in your area of interest – who are the rising stars and which types of work is becoming more valuable and for which therapies.
How do I drive these Sunshine payment analyses?
With our extensive experience in healthcare data analytics and proprietary name matching software, Snowfish can perform custom analyses for you in a short time frame, and provide automatic refreshes to the analyses whenever new data is released.
We have a white paper available for you covering the Open Payments database and its possibilities in more detail, and also have a real example of an analysis in Excel. The example shows the 30 most highly paid psychiatrists and neurologists, where we calculate the total payments made to each physician in each of a number of categories, and show not just the companies making the payments but also the associated drugs for the payments.
If you are interested in learning more about Snowfish’s industry-leading approach to healthcare data discovery and mining, and how we can help with your custom Sunshine Payment analyses, please feel free to reach out to us at info@snowfish.net. This is the time to capitalize on this fascinating opportunity.
- Market Access: The Latest Hurdle for Treating Alzheimer’s and Dementia - June 14, 2023
- Rare Disease Outreach a Missed Opportunity - November 7, 2022
- So You Read Our Previous Post on Biomarkers? - August 1, 2022
